Grafana
Grafana is one of those things that I had tried it out at least ten times. I would install a docker, follow a guide and when it wouldn’t work immediately I promptly gave up.
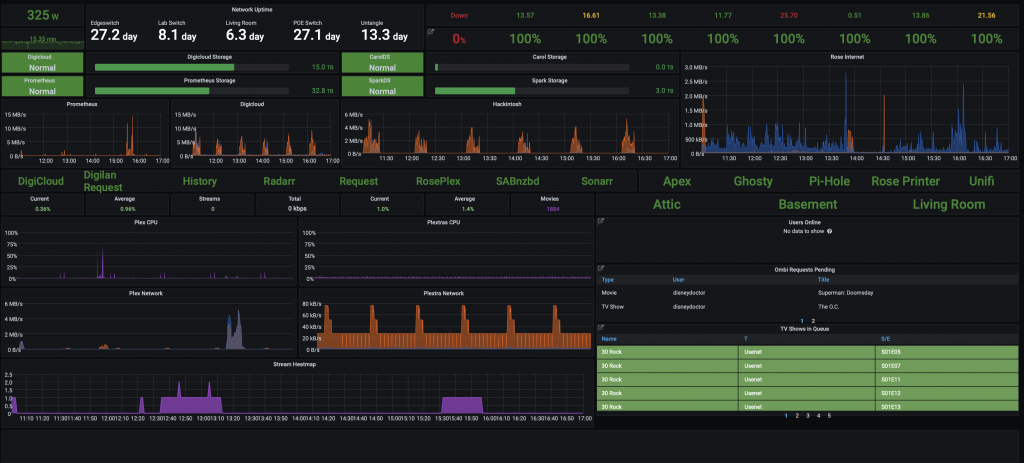
Until I didn’t. During the pandemic, I spent a solid weekend ignoring my family and configuring Prometheus and Grafana, lots of trial and error and lots of do overs later, I have something that I’m pretty pleased with. Using a reverse proxy through my Synology, I have it set to Grafana.Digilan.org but you can’t get there unless you’re on the network. Which given the audience of this blog, there’s actually a fair chance you are.

This dashboard went through at least a dozen changes, after learning about variables I created a separate dashboard for the remote sites once I realized not everything would fit on one page anyway. This page captures just about everything important on my network at this point, though I did see another guy using Home Assistant to capture information from homekit. That would be sort of fun to put on there.
